TAU2.27.2
Tuning and Analysis Utilities.
- Development
- Debugers and Optimizers

TAU Performance System is a portable profiling and tracing toolkit for performance analysis of parallel programs written in Fortran, C, C++, Java, Python.
TAU (Tuning and Analysis Utilities) is capable of gathering performance information through instrumentation of functions, methods, basic blocks, and statements. All C++ language features are supported including templates and namespaces. The API also provides selection of profiling groups for organizing and controlling instrumentation. The instrumentation can be inserted in the source code using an automatic instrumentor tool based on the Program Database Toolkit (PDT), dynamically using DyninstAPI, at runtime in the Java virtual machine, or manually using the instrumentation API.
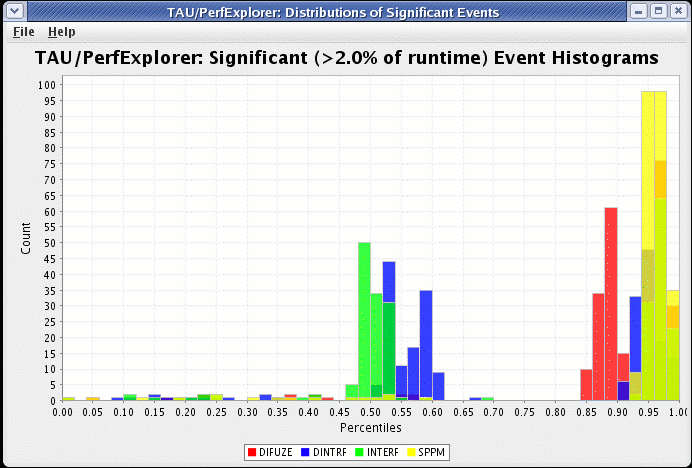
TAUs profile visualization tool, paraprof, provides graphical displays of all the performance analysis results, in aggregate and single node/context/thread forms. The user can quickly identify sources of performance bottlenecks in the application using the graphical interface. In addition, TAU can generate event traces that can be displayed with the Vampir, Paraver or JumpShot trace visualization tools.
- linux
- Downloads2060
- LicenseFree to use but restricted
Downloads / Release History
- downloads.php
- downloads.php


