Zoom3.2.0
Low-overhead graphical and command-line profiler.
Tuesday, August 6, 2013
- Development
- Debugers and Optimizers
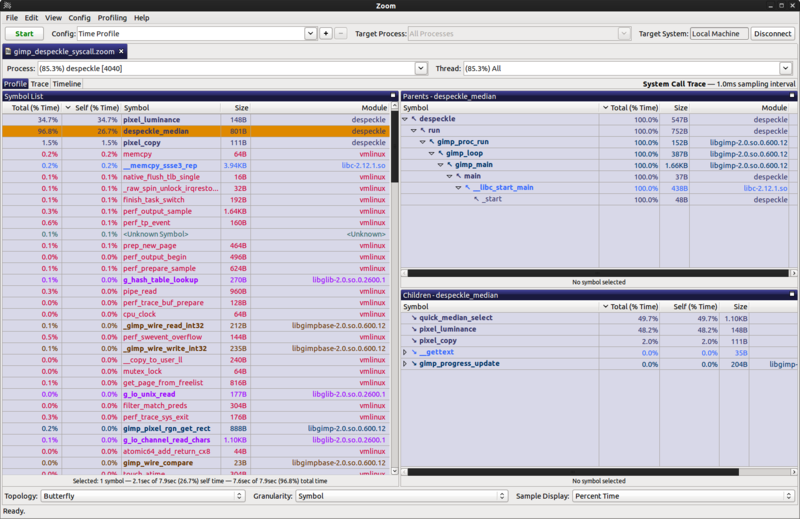
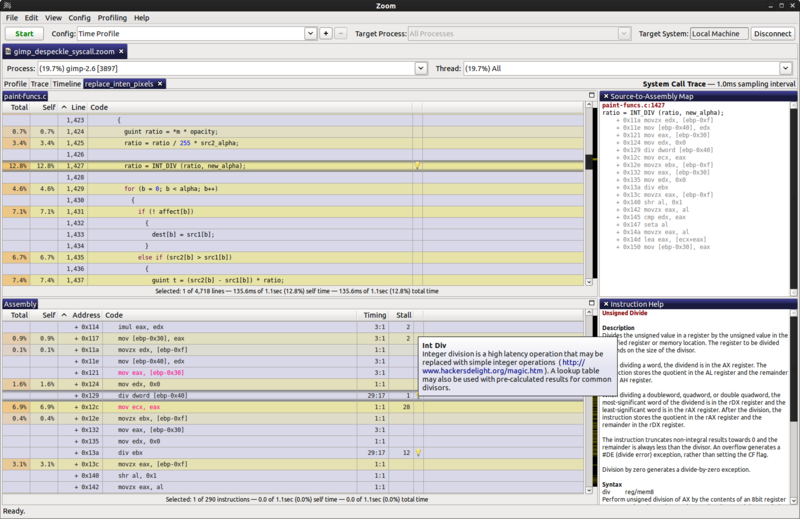
Zoom is a low-overhead graphical and command-line profiler for Linux. A Zoom profile is system-wide, precise down to the instruction level, and captures backtraces. This lets you see exactly what was running, where time was spent, and how that code was called. You can drill down into critical code to get detailed performance data. Zoom analyzes and annotates your code with specific tuning advice for many compilers and processors. Share what you find with colleagues or archive it for later review. Zoom saves profiles as a single, self-contained session file that can be emailed or attached to bug reports. Zoom also supports remote network profiling and scripting.
- linux
- Downloads5869
- LicenseCommercial
- Platformsx86, x86_64, ARM or ppc64 Linux
- RequirementsLinux with kernel 2.6.9 or later
- Tags
Screens and Previews
Downloads / Release History
August
06
2013
Zoom 3.2.0
Changes Added ability to view sample count/time and percentage simultaneouslyAdded option to group samples by process name rather than PIDChanged default hot key to start/stop profiling to Shift-F1Added option to install to custom path on LinuxFixed to not create .debug folder when using perf driverFixed to work with perf driver on Linux kernel 3.9Fixed monitoring of exited processes on Linux kernel 3.7 and laterUser interface and performance improvements
- http://www.rotateright.com/
- download-zoom
January
29
2013
Zoom 3.0.2
Changes This release adds minor improvements to x86 code analysis and fixes identification of Intel Ivy Bridge processors. It also adds support for Intel Haswell, Intel Atom (Cloverview) and AMD Famiy 16h (Jaguar) processors. An issue with automatic process/thread selection when filtering is enabled has also been fixed.
- http://www.rotateright.com/
December
26
2012
Zoom 3.0.1
Changes Fixed option to disable gathering kernel symbols on small systemsUser interface and performance enhancements
- http://www.rotateright.com/
October
24
2012
Zoom 3.0.0
Changes Profiling of Mac OS X systems has been added including Time Profile (system-wide), Thread Time Profile and Static Analysis of Mach-O files. Profile data can now be filtered by thread or process. Code Browsers can now load a different source file than was discovered automatically. Bookmark annotations can be added to the Timeline to label points of interests in a profile. x86 system instructions have been added to the integrated instruction reference. Support for Linux 3.5 and later kernels has been added. Power management can now be temporarily disabled during profiling on all kernels.
- http://www.rotateright.com/
July
06
2012
Zoom 2.2.1
Changes This release adds x86 instruction help for AVX, FMA, XOP and BMI. Selection of target processes with very large amounts of debug information has been fixed. Westmere EX Xeon processors are now correctly identified. The inability to launch Zoom on systems with misconfigured locale has been fixed as well as an issue with unreadable links in /tmp. A variety of user interface and performance improvements are also included.
- http://www.rotateright.com/
May
18
2012
Zoom 2.2.0
Changes Added profile time filtering Added ability to find text in both visible and hidden call tree entriesAdded support for Intel 'Ivy Bridge' CPUsAdded 'perf' driver support for RHEL / CentOS 6.2Improved support for multiple monitor configurationsFixed Thread Time profiling on ARMFixed Thread Time profiling bug when many threads createdUser interface and performance improvements
- http://www.rotateright.com/
April
11
2012
Zoom 2.1.2
Changes This release fixes the tracking of exited processes and threads as well as Thread Time profile time stamps. The zoomscript API example has been improved and there have been a variety of user interface and performance enhancements.
- http://www.rotateright.com/
April
05
2012
Zoom 2.1.1
Changes This release fixes compilation of the rrprofile driver with the Linux 3.3 kernel. An problem when opening Scheduler Trace profiles has been fixed. Installation of debug info on SUSE Linux Enterprise has been fixed. Disassembly of the x86 jmp far instruction has been fixed. A variety of user interface and performance improvements are also included.
- http://www.rotateright.com/
March
30
2012
Zoom 2.1.0
Changes This release adds support for the perf profiling driver including thread scheduler and system call tracing. Multi-threaded behavior can now be visualized with the new timeline view. Call trees have been enhanced to distinguish symbols by module. Code analysis for AMD Family 15h has been added as well as support for the AVX, VMX and SVM instruction sets. DWARF information generated by gcc 4.6 is now supported. Network control of profiling has been improved. The Zoom GUI is now available for Mac OS X and Windows so that you can view profiles and control profiling from any machine.
- http://www.rotateright.com/
Related Apps
Xdebug 2.1.3
Helps you debugging your script.
Gnome-crash 0.0.5
Small utility that displays and prints a stack trace information after a crash.
TAU 2.27.2
Tuning and Analysis Utilities.
BitNami Mantis Stack 1.2.11-0
An easy-to-install distribution of Mantis.
QuickBugs Linux 1.0
Bug Tracking Made Easy!.
Comments
No comment. Be the first to enter a comment.